
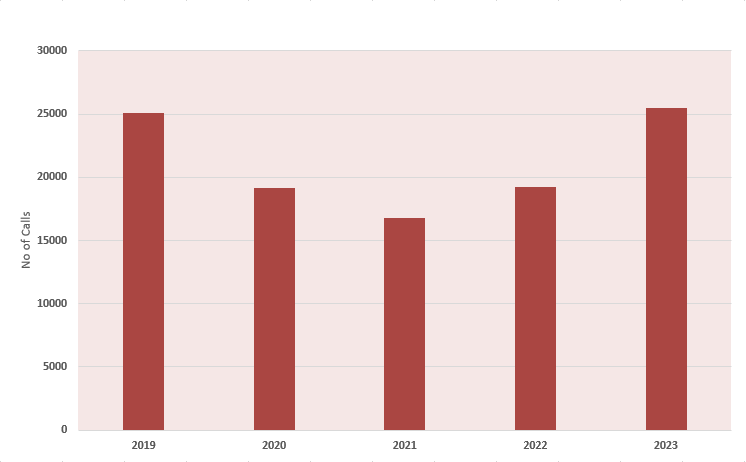
No. of fire calls in last 5 year
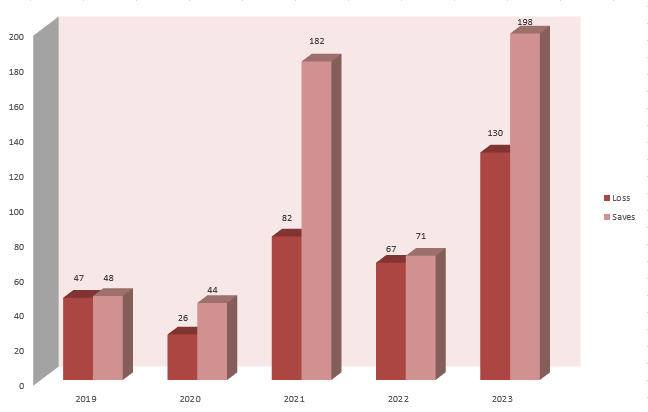
No. of lives saved & lost in last 5 years
| Fire Statistics From 1985 TO 2023 | |||||
| Year | No. of Fire Accidents | Property (Rupees in Crores) | Human Lives | ||
| Loss | Saved | Loss | Saved | ||
| 1985 | 8,795 | 5.84 | 68.65 | 141 | 345 |
| 1986 | 8,937 | 5.27 | 58.21 | 137 | 425 |
| 1987 | 10,668 | 8.20 | 60.72 | 182 | 271 |
| 1988 | 10,200 | 3.98 | 35.01 | 126 | 148 |
| 1989 | 10,330 | 4.72 | 64.23 | 178 | 211 |
| 1990 | 10,341 | 7.36 | 64.32 | 140 | 274 |
| 1991 | 12,157 | 10.47 | 53.42 | 98 | 99 |
| 1992 | 12,996 | 10.16 | 93.41 | 96 | 208 |
| 1993 | 14,212 | 10.54 | 100.80 | 38 | 122 |
| 1994 | 11,120 | 16.76 | 144.68 | 44 | 255 |
| 1995 | 12,706 | 14.28 | 88.08 | 134 | 87 |
| 1996 | 12,741 | 46.43 | 176.45 | 72 | 119 |
| 1997 | 13,678 | 73.28 | 181.19 | 187 | 120 |
| 1998 | 15,146 | 21.77 | 175.34 | 90 | 155 |
| 1999 | 16,367 | 13.64 | 131.93 | 72 | 78 |
| 2000 | 16,987 | 13.98 | 157.18 | 47 | 77 |
| 2001 | 17,697 | 15.79 | 137.86 | 112 | 107 |
| 2002 | 18,264 | 14.10 | 114.41 | 79 | 179 |
| 2003 | 16,109 | 24.57 | 122.01 | 89 | 177 |
| 2004 | 16,136 | 13.07 | 130.07 | 249 | 619 |
| 2005 | 15,093 | 14.2 | 93.21 | 99 | 270 |
| 2006 | 17,442 | 27.74 | 131.02 | 65 | 122 |
| 2007 | 21,224 | 26.87 | 195.73 | 72 | 88 |
| 2008 | 17,433 | 53.17 | 446.56 | 69 | 139 |
| 2009 | 21,840 | 53.17 | 255.93 | 127 | 176 |
| 2010 | 18,311 | 24.60 | 335.24 | 75 | 100 |
| 2011 | 22,219 | 27.59 | 335.68 | 84 | 16 |
| 2012 | 32,273 | 27.02 | 337.99 | 87 | 137 |
| 2013 | 25,109 | 42.55 | 338.33 | 75 | 85 |
| 2014 | 24,393 | 46.13 | 564.60 | 70 | 143 |
| 2015 | 19,866 | 22.47 | 241.08 | 38 | 52 |
| 2016 | 25,897 | 43.04 | 582.96 | 72 | 89 |
| 2017 | 21,041 | 97.87 | 298.25 | 67 | 96 |
| 2018 | 22,601 | 58.83 | 292.84 | 36 | 69 |
| 2019 | 25,068 | 31.00 | 325.59 | 47 | 48 |
| 2020 | 19,142 | 19.40 | 156.12 | 26 | 44 |
| 2021 | 16,809 | 79.86 | 240.53 | 82 | 182 |
| 2022 | 19,206 | 29.76 | 249.65 | 67 | 71 |
| 2023 | 25, 469 | 18.64 | 303.55 | 130 | 198 |